In the recent years, the issue of CO2 emission has become a big topic in the world, presenting a significant challenge for politicians and environmental advocates. Like many regions worldwide, the European countries have worked hard to decrease CO2 emission to reduce the effects of climate change.
A Historical Analysis of CO2 Emissions in Europe
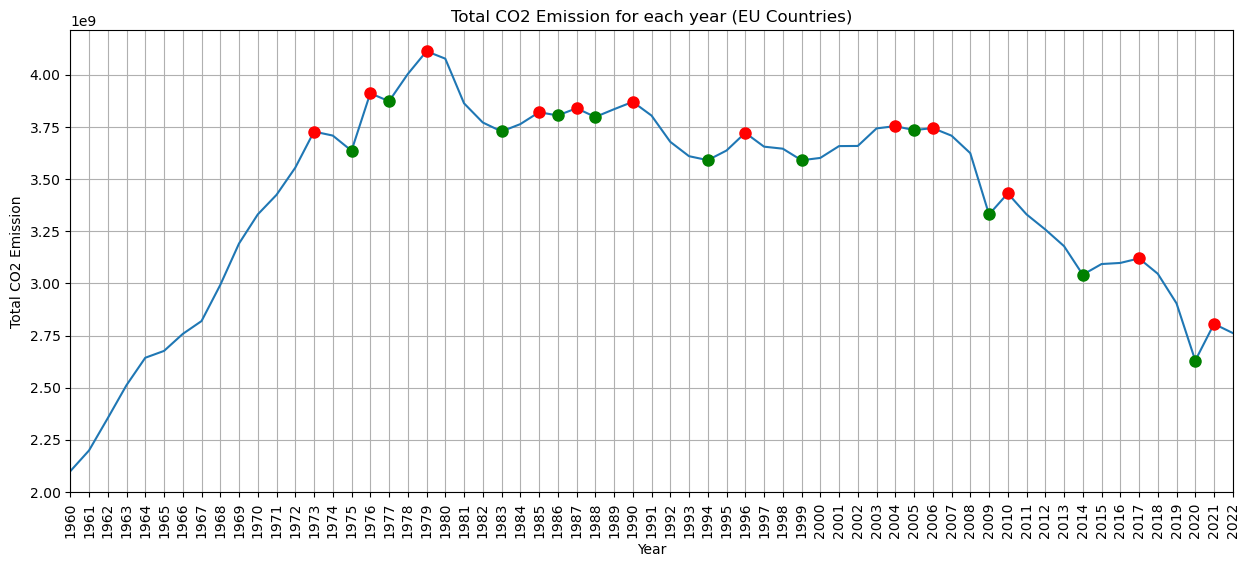
The journey into understanding CO2 emission begins with looking into historical data, shown through a line plot. The line plot showcases the CO2 emission from 1960 to 2022, revealing a remarkable increase in 1979 and a notable decrease afterwards with the lowest levels of CO2 emission in 2020.
 Europe's CO2 Emission Journey (1960-2022)
The plot is an overview of Europe's CO2 Emission Journey from 1960 to 2022.
The y-axis represents the total co2 emission, while the x-axis represents every year from 1960-2022.
Each peak is colored in red dots, while each valley is colored in green.
The highest CO2 emission occurred in 1979, while the lowest CO2 emission occurred in 2020.
Europe's CO2 Emission Journey (1960-2022)
The plot is an overview of Europe's CO2 Emission Journey from 1960 to 2022.
The y-axis represents the total co2 emission, while the x-axis represents every year from 1960-2022.
Each peak is colored in red dots, while each valley is colored in green.
The highest CO2 emission occurred in 1979, while the lowest CO2 emission occurred in 2020.
1979: The Second Oil Crisis and Industrial Impacts
In 1979, a huge increase in CO2 emission occured. The second oil crisis happened in 1979, which was an aftermath of the Iranian revolution. It was the disruption in oil production from Iran that caused the decline in global supply, since the Iranian leader Ayatollah Khomeni decided to cut the export by 50 percent to force most governments of the oil-consuming countries to take the energy problem seriously. Because of the shortage of oil, which EU countries heavily relied on for energy, transportation, and industry, the energy prices increased and the world started to shift the energy production away from oil to coal. The transition caused CO2 emission levels to increase, since coal produces more CO2 emissions per unit of energy compared to oil.
Now if we take a closer look into 1979 through a map plot, we see that countries such as Germany, Poland, France and Italy had high CO2 emission. These countries are all industrialized countries, facing similar battles in decreasing CO2 emission levels, where Germany was the EU country with the highest CO2 emissions at that time.
Comparative Analysis of CO2 Emissions Across Europe
In 1979, Germany faced some factors that contributed to its high CO2 emissions, such as the second oil crisis. Because of the crisis, Germany transitioned to coal and highly relied on it for its energy production. Since Germany is a industrial country, the increase of CO2 emission was a combination of historical factors and the countries industrial landscape.
Additionally, the structure of Germany's economy, emphazised heavily on industries such as steel production, chemical manufacturing, and cement production, which generates higher CO2 emissions compared to other countries with less industrialized economies.
While Germany's CO2 emissions were influenced by the countries industrial landscape and historical factors, it's essential to contrast this with the emissions of other European countries, with less CO2 emissions. Malta, Cyprus and Portugal stood out among the European countries for their low CO2 emissions during the same period, where Malta had the lowest CO2 emissions that year.
Malta is a relatively small country with a small population, and a less industrialized economy compared to larger European countries, such as Germany. With Malta having less heavy industries such as steel production, chemical manufactoring, and cement production, Malta's carbon footprint was much lower.
Similarly, countries like Portugal and Cyprus with their less industrialized economies, resulting in less CO2 emission levels.
Impact of the COVID-19 Pandemic on CO2 Emissions
As seen in the line plot, a notable decrease happened in 2020, where the CO2 emissions hit the lowest level in EU after 1979. In 2020 the world was hit by a pandemic known as COVID 19, which slowed down the global economy and caused the CO2 emission levels to decrease.
Due to the quarantine in the covid 19 pandemic, changes in consumer behavior and lifestyle choices occured, which influenced energy consumption patterns and emission levels. A notable phenomenon was the shift towards remote work, which meant a decrease in transportation related emissions.
When taking a closer look at the map plot, Germany still remains the country with the highest CO2 emission, while Malta continues to be the country with the lowest level of CO2 emissions. Despite the countries still holding their spots, both countries still experienced a reduction in CO2 emissions.
Steps Towards Reduction: Germany's Initiatives
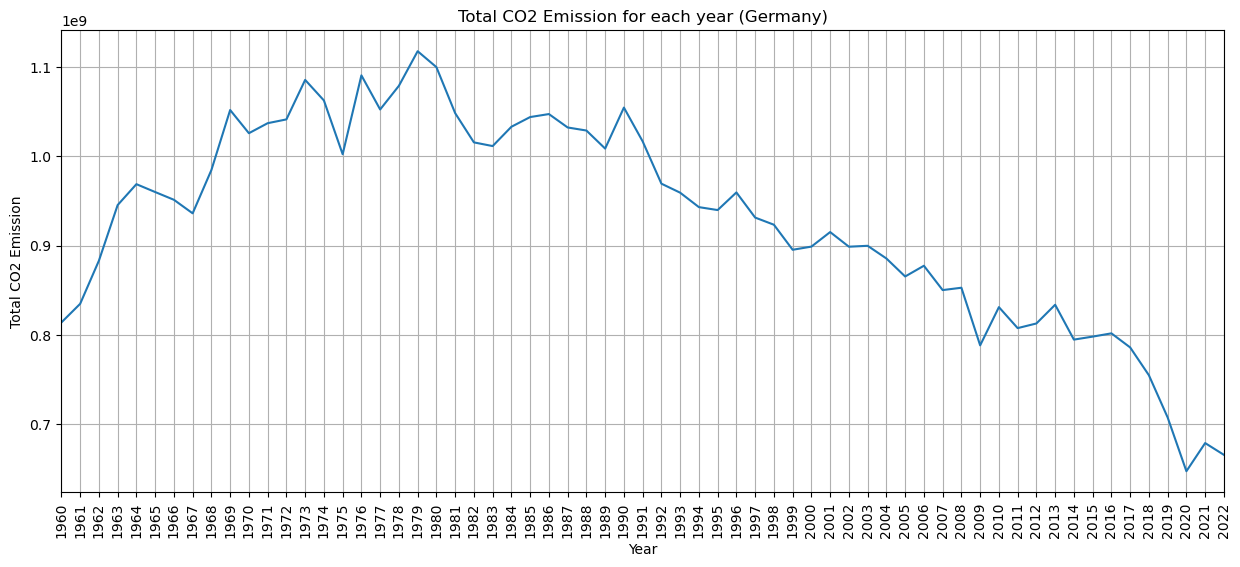
There has been a noticecable decrease over the years in Germany, when it comes to CO2 emission, which can be seen through the line plot. This decline reflects the efforts in adressing the issue of climate change.
 Germany's CO2 Emissions from 1960-2022
The plot is an overview of Germany's CO2 Emission Journey from 1960 to 2022.
The y-axis represents the total co2 emission, while the x-axis represents every year from 1960-2022.
The highest CO2 emission occurred in 1979, while the lowest CO2 emission occurred in 2020.
Germany's CO2 Emissions from 1960-2022
The plot is an overview of Germany's CO2 Emission Journey from 1960 to 2022.
The y-axis represents the total co2 emission, while the x-axis represents every year from 1960-2022.
The highest CO2 emission occurred in 1979, while the lowest CO2 emission occurred in 2020.
Germany has implemented a series of initiatives aimed to reduce CO2 emissions to transition towards a more sustainable energy landscape. Germany has decided to increase the pricing for the transport sector and for heating buildings. They are actively promoting the use of energy-saving buildings, renewables and alternative technology in the transportation sector, such as electric mobility.
In 2021, companies were required to pay a CO2 price, where Germany changed the pricing of fossil fuels such as oil, gas, petrol and diesel. As for 2019, about 43 percent of electric power was generated from renewable sources, such as wind and solar power. Since 2020, home owners have also had the opportunity to receive a payment for replacing old oil central heating, further reducing the CO2 emissions.
Moreover, Germany has been exploring and implementing a series of initiatives, showing the strong commitment to reduce CO2 emissions. Currently, their plan is to reduce greenhouse gas emission by 55 percent before 2030, by ending the usage of coal to generate electic power and restructure their mobility.
Shaping a Sustainable Future
As we navigate the 21st century, it's important to recognize the historical events and the correlation to CO2 emissions. By learning from the past and getting insights from the historical analysis, we can get a deeper understanding of how future events might impact CO2 emissions. With this knowledge we are better equipped to predict the challenges and also opportunites that lie ahead of us.
Trough strategic policy interventions, investing in renewable energy, such as solar and wind power and adaption measures, such as transitioning to low-carbon transportation, we can move towards a more sustainable future.
Ultimately, the lessons drawn from Europ's CO2 emission history serve as a reminder to take action. As we navigate into the dynamics of climate change, the relationship between CO2 emissions and its potential effects on global weather patterns becomes apparent.
In the next blog, we will look into extreme weather events and explore if CO2 emissions can potentially affect climate conditions.
Photographs by Pexels.
Reference from AIP ORG, EU Science Hub, PMC PubMed Central and The Federal Government (bundesregierung.de)